
Written by Mary Ann Binnie, Nutrition Consultant

We like numbers. Numbers are absolute, definitive. Neat and tidy. We use them as statistics in many facets of life – even when describing how much food we eat. But depending how statistics are derived, you may see that the numbers vary across different news articles and publications. It all comes down to how the stats are derived.
Let’s look at the back-story of how we get the stats on just how much meat Canadians eat – after all, it all comes down to ‘the meat of the matter’!
Here are two of the main tools that Statistics Canada uses to report on meat consumption in Canada: the Canadian Community Health Survey (Nutrition) and Meat Availability (Disappearance) Data.
Canadian Community Health Survey (Nutrition)
The Canadian Community Health Survey (CCHS) is conducted annually; however, a nutrition component was tacked on in 2004 and 2015 at the request of Health Canada[i].
The 2004 and 2015 CCHS nutrition surveys conducted 24-hour dietary recalls on a representative sample of Canadians which provided a snapshot of what the respondents ate one day in time. Using a “Food Model Booklet” respondents described the size or amount of the food they ate in one 24-hour period. Done by interview, the questioning also delved into the type of food consumed – for example, was it lean ground beef or extra-lean, and also how the food was prepared – was it pan-fried or grilled. Even cooking practices were noted, such as whether ground beef was drained after cooking or not.
This type of data collection was then tailored for analysis by age, gender, province, and by foods to allow an examination of diet quality; not just quantity. For example, white bread is differentiated from whole grain bread. For foods that require cooking before eating, data is collected ‘as consumed’ meaning meat is reported on a ‘cooked’ versus ‘raw’ basis. This is an important distinction since there is about a 64 percent yield going from raw beef to cooked. For example, a 125 gram raw steak yields about a 75 gram cooked portion.
Dietitians and other health professionals in the nutrition community put a lot of stock in the CCHS data, using these statistics to inform nutrition policy. Health Canada used CCHS data to assess how Canadians are doing to meet Canada’s Food Guide[ii] recommendations. As well, the Heart & Stroke Foundation of Canada used CCHS data to develop their recommendation for Canadians to be mindful of the amount of ultra-processed foods they are eating[iii].
Although CCHS data is the closest we get to measuring what Canadians are eating, we do need to appreciate that 24-hours recalls are not laser-accurate. Respondents tend to under- or over-report on foods perceived as ‘bad’ and ‘good’. And it is also difficult for respondents to report on portion size especially with mixed dishes like a stir fry or a wrap. There is also difficulty honing in on food details – like the cut of meat and cooking method – especially if the respondent did not prepare the meal. With these limitations in mind, it is important to cross-check the data with other consumption information such as Meat Availability (Disappearance) Data.
Meat Availability (Disappearance) Data
Another tool used to gauge meat consumption is Statistics Canada’s disappearance or food available for consumption data[iv]. These data figures, which are reported annually, are derived as follows:
Total supply (inventory of meat at the beginning of the year + production + imports)
Minus (-) outputs (exports, waste, and inventory of meat at the end of the year)
= net supply
÷ Canadian population (as of July 1st)
= meat available per person (in that given year)
These data can be presented in a few ways:
- Carcass weight – includes meat, skin, bone and trimmed fat
- Retail weight – amount of meat available per person at the retail level after removing the skin, bone, and trimmed fat
- Retail weight, boneless weight equivalent – higher degree of trimming and the weight of all bones is removed
- Retail weight, adjusted for losses – storage, preparation, and cooking losses along with plate waste are deducted from the retail weight. Provides a proxy of fork-level consumption.
These data reflect average daily consumption. Some days we may eat more; other days less. Some people consume more; others less, for instance a toddler versus a teenager.
Comparing the Numbers
So, how do these numbers stack up when you compare these two sources of data measurement?
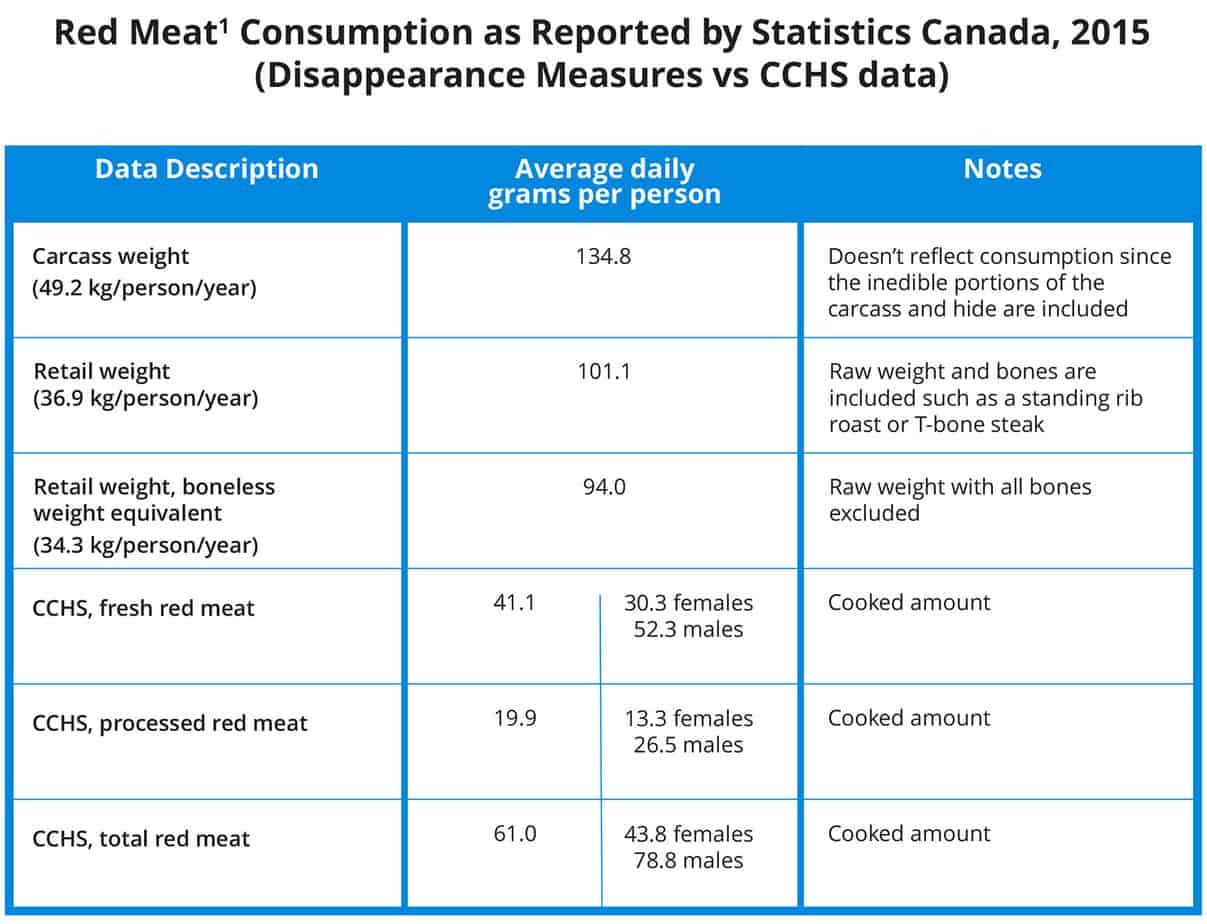 1 Includes beef, veal, pork, and lamb.
CCHS data can be tailored to reflect how much and types of food people actually ate. Women, on average, eat less meat than men, a fairly small amount in fact – 44 grams on average a day, whereas men, consume 79 grams a day – just over a 75-gram Food Guide serving for meat. These figures represent averages of all females and males over 1 year of age.
Disappearance data are most useful for determining trends over time. For example, meat consumption has declined whereas vegetable oils have increased over the past couple decades.
Given the various permutations for reporting meat consumption data, it is understandable when consumption numbers in different publications or articles do not match up. The key is to decipher the numbers. To dig deeper for the description of the data. To determine if it is a ‘cooked’ or ‘raw’ weight for meat since a 34% loss during cooking makes a difference.
Yes, we like numbers. We just need to know how to interpret them correctly!
[i] Canadian Community Health Survey – Nutrition, www23.statcan.gc.ca/imdb/p2SV.pl?Function=getSurvey&Id=201486
[ii] Evidence Review for Dietary Guidance, Technical Report, 2015, Health Canada
[iii] Ultra-processed foods in Canada: consumption, impact on diet quality and policy implications, December 2017, Heart and Stroke Foundation of Canada
[iv] Food Availability (per person) www23.statcan.gc.ca/imdb/p2SV.pl?Function=getSurvey&SDDS=3475


